Almost half of all major US data centres sit in a single region: Northern Virginia. My undergraduate thesis investigates whether this extraordinary concentration of computing infrastructure has measurably reshaped the state's — and its neighbours' — electricity markets.
Key Takeaways
- Consumption impact — US electricity consumption had been stable for three decades. Data centres in Virginia now consume around 25% of the state's total electricity, fundamentally reshaping consumption patterns.
- Price spillover — Virginia's data centres exercise measurable price pressure on surrounding electricity markets. Residential, commercial and industrial consumers in neighbouring states already experience the consequences.
- AI is an addition, not the origin — The power consumption trend from data centres started well before 2022. LLMs and "AI" have orders of magnitude higher power-per-compute costs, but they are an addition to a baseline that was already surging.
The Scale of Virginia's Data Centre Industry
Virginia dominates the United States' data centre industry with almost half of all national capacity being installed within the state's borders (JLARC, 2024). The sheer scale of the existing computing infrastructure, along with unique geographic properties of Virginia, offers an opportunity to analyse the impact of data centres on local and regional electricity markets. The growth of the industry has resulted in unprecedented power demand needed to sustain the newly added infrastructure. Since pre-Covid 2019, Virginia has increased its commercial electricity consumption almost as much as Texas — a state with 3.5 times bigger population, and 4.5 greater GDP.
Northern Virginia alone accounts for 41% of global and almost 50% of US installed data centre capacity. No other market comes close.
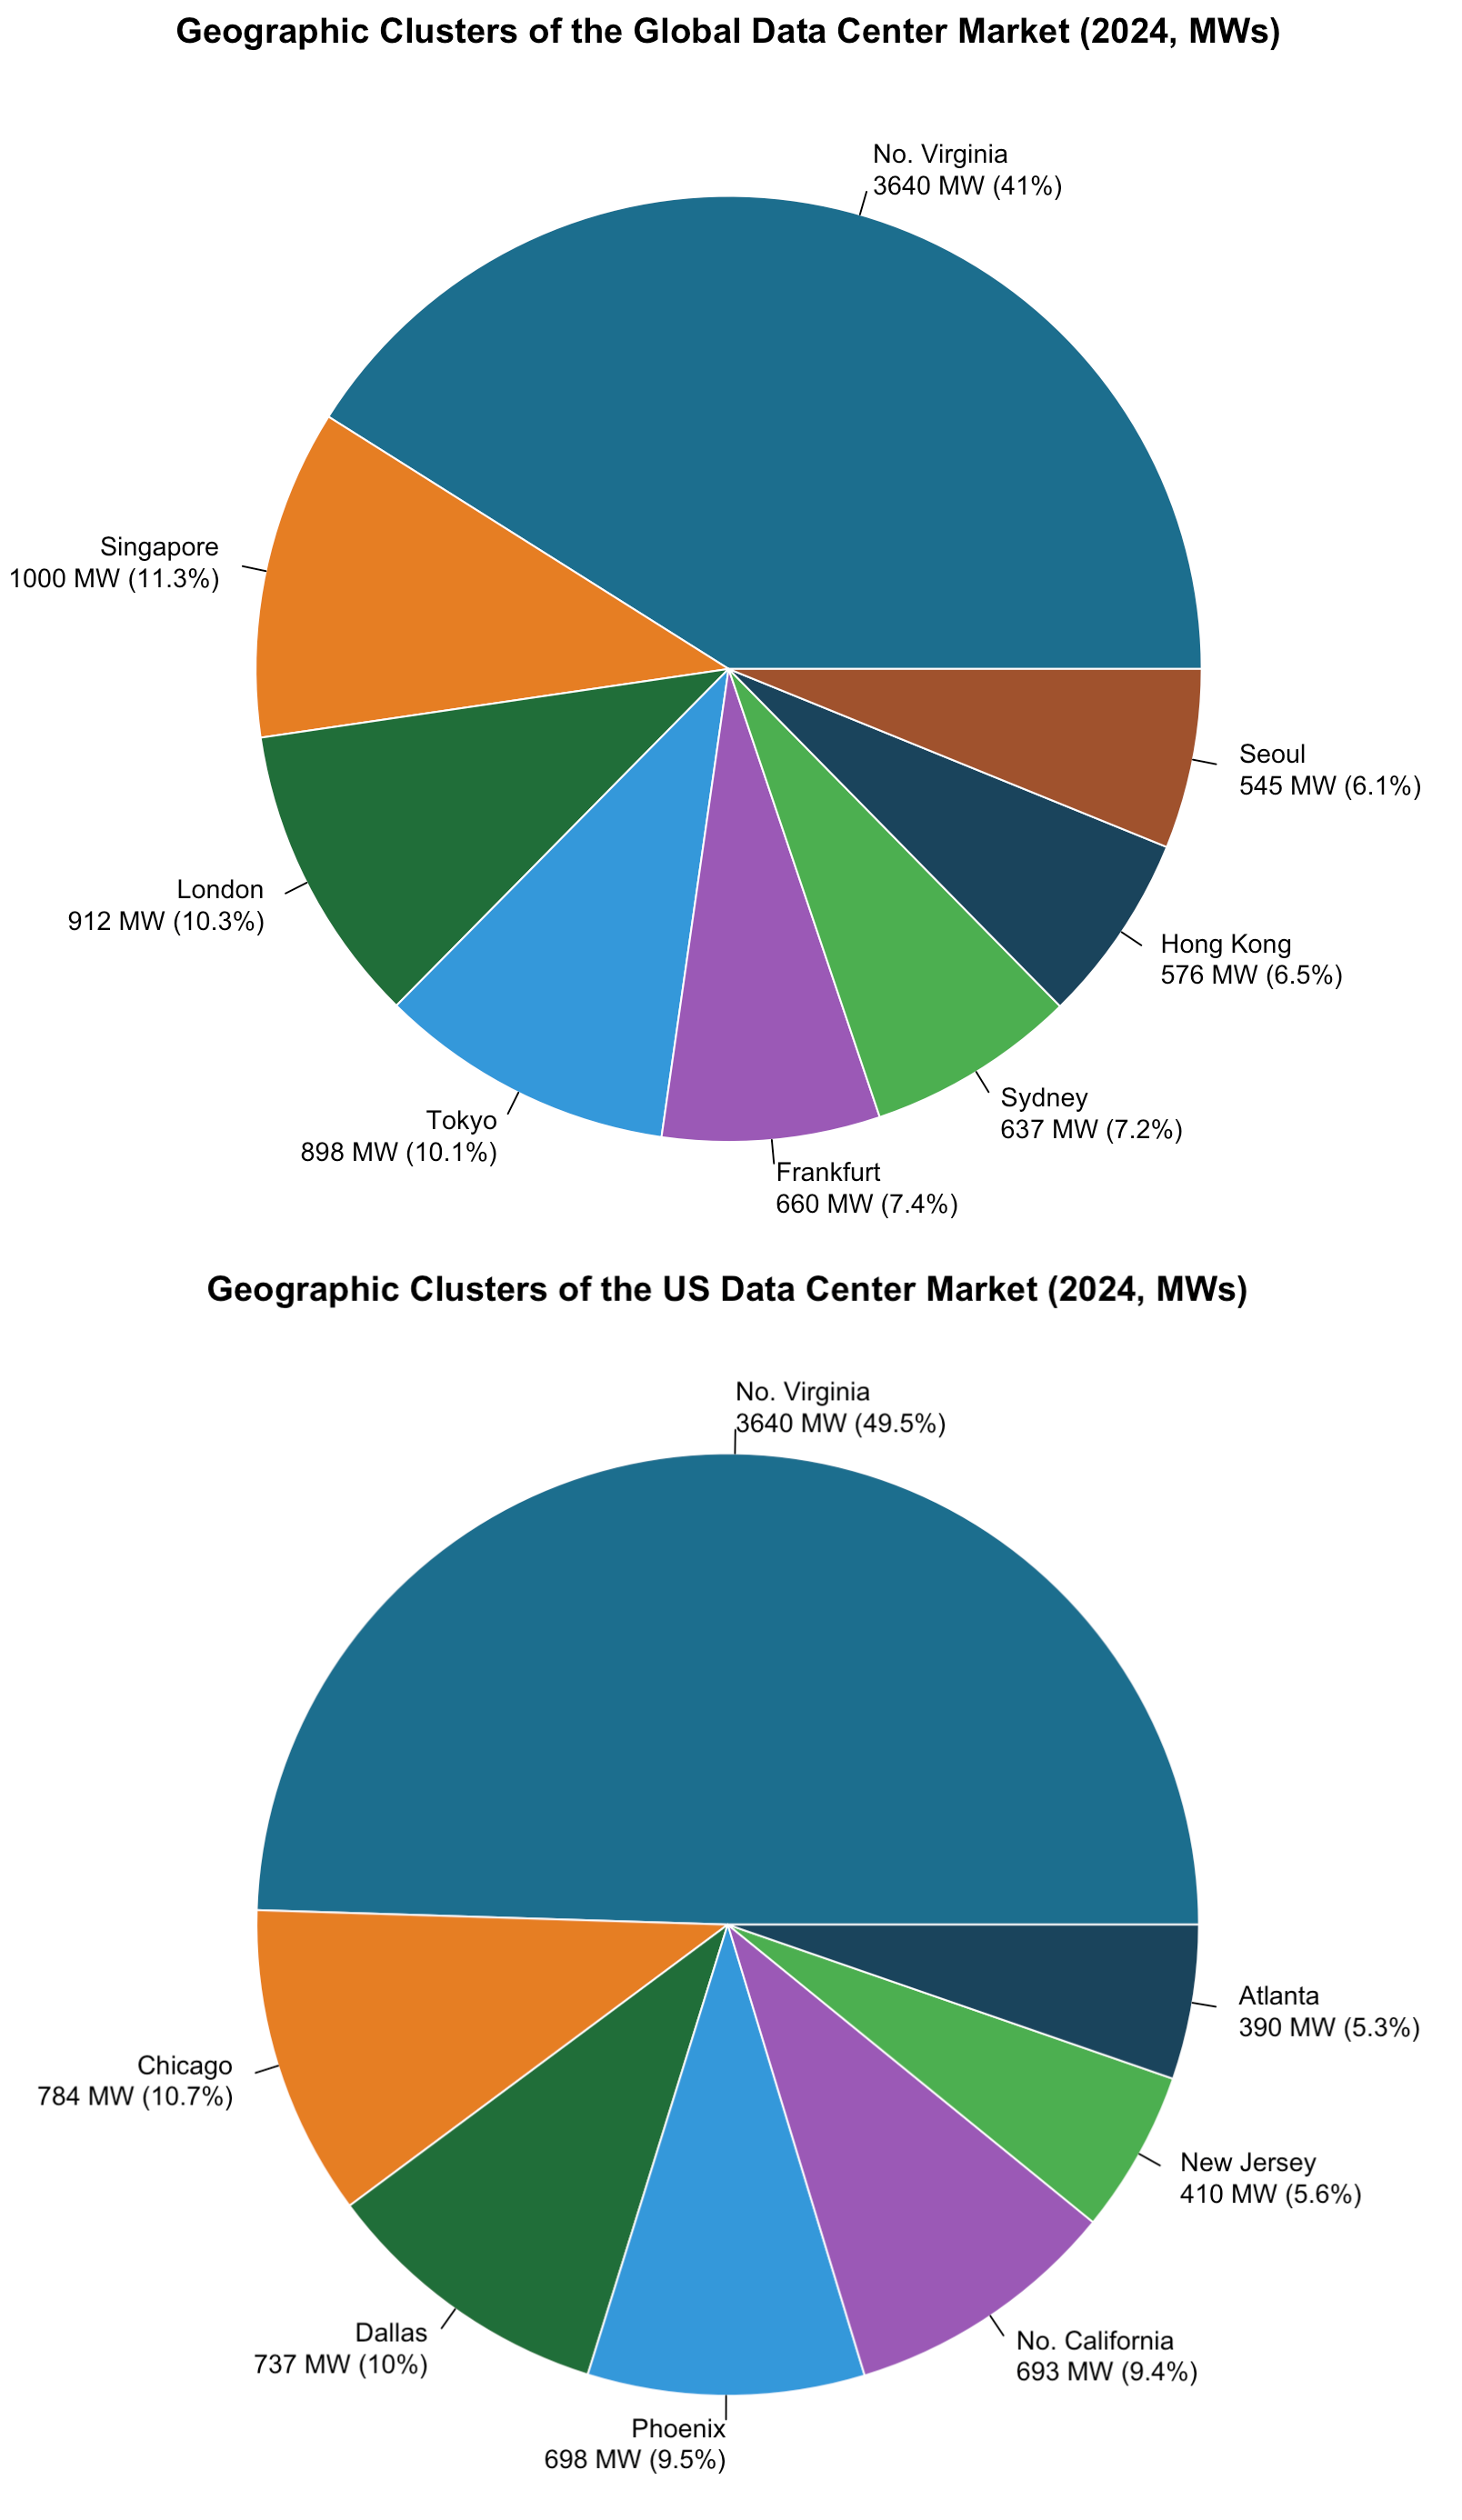
Figure 1 — Geographic clusters of the global and US data centre market. Northern Virginia holds 3,640 MW, dwarfing every other cluster worldwide.
A Unique Regional Anomaly
Importantly for this study, Virginia is the only state in Northeastern US to experience a major growth in commercial electricity consumption, while other regional states do not demonstrate similar patterns of demand.
The chart below compares commercial electricity consumption across several states in the US Northeast and Southeast. While Maryland, Pennsylvania, North Carolina, Tennessee and West Virginia track a largely flat trend over 25 years, Virginia diverges sharply upward after roughly 2015 — a trajectory that only accelerates post-2019.
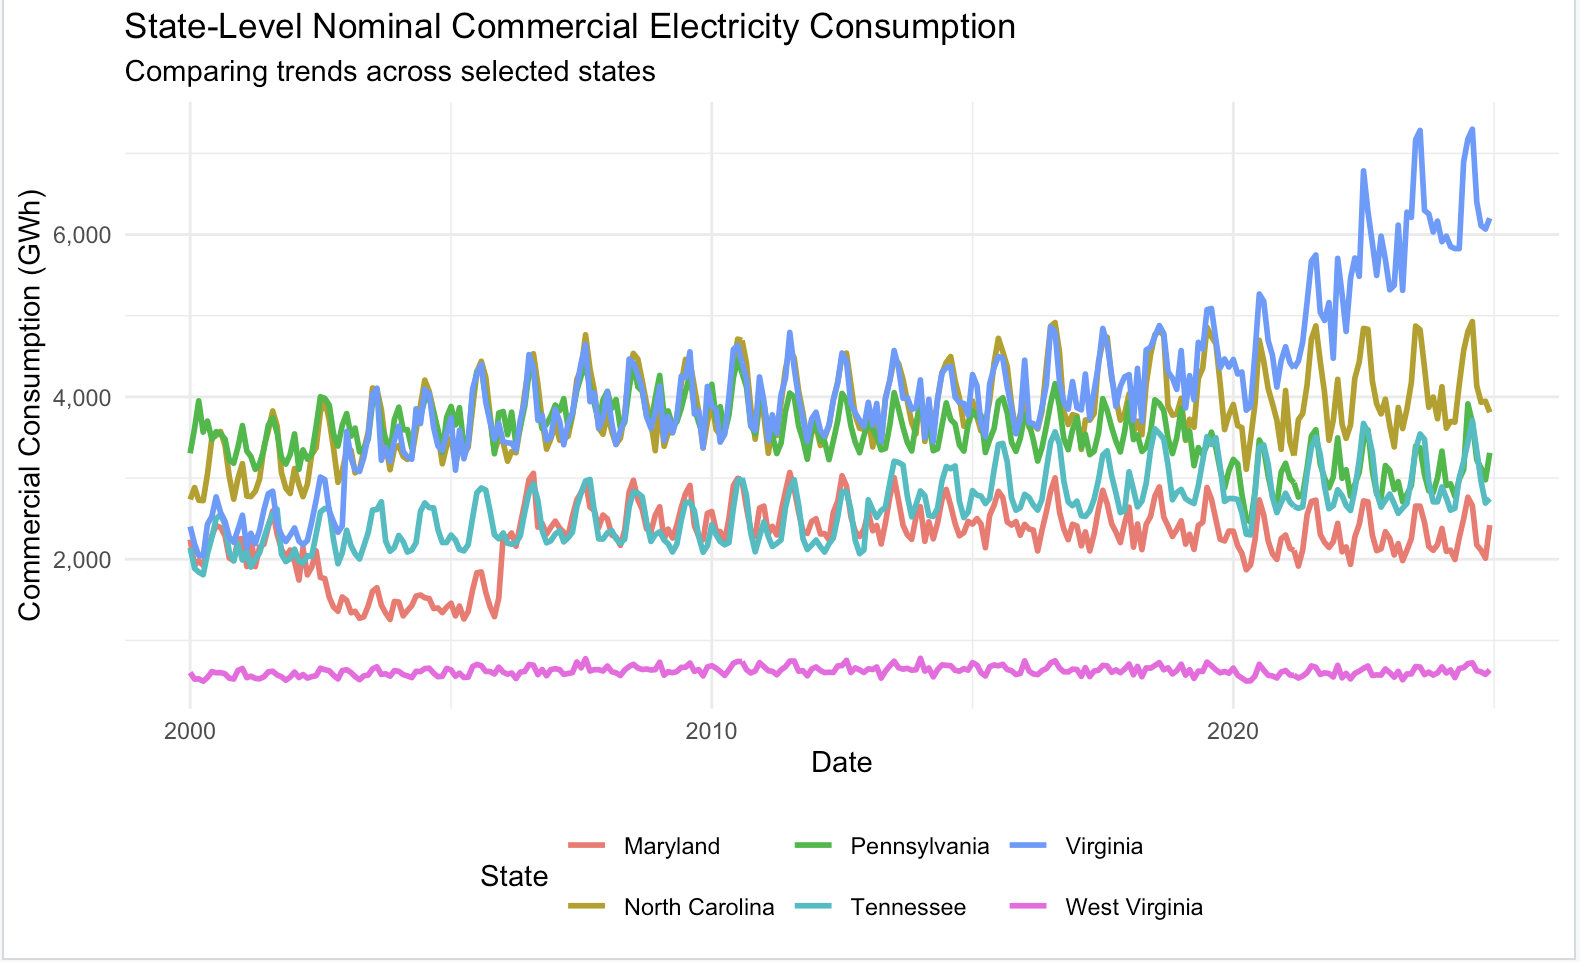
Figure 2 — State-level nominal commercial electricity consumption (GWh). Virginia's consumption breaks away from the pack.
The study seeks to verify whether such power demand shock has impacted local electricity markets.
Methodology: Structural Break & Synthetic Control
To isolate the data-centre effect I take a two-step approach:
- Structural break test — I first investigate whether there was a statistically significant structural break in Virginia's commercial power consumption, i.e. whether there was a sufficiently strong change in the electricity demand pattern.
- Synthetic control analysis — Following Abadie and Gardeazabal (2003), I construct a Synthetic Virginia: a weighted combination of other states that mimics Virginia's pre-treatment consumption trend. The gap between the real and synthetic series is the estimated treatment effect of the data-centre industry.
The identification assumption is that data centres are primarily located based on exogenous geographic proximity to internet fibre networks — not electricity-market characteristics — allowing clean causal inference.
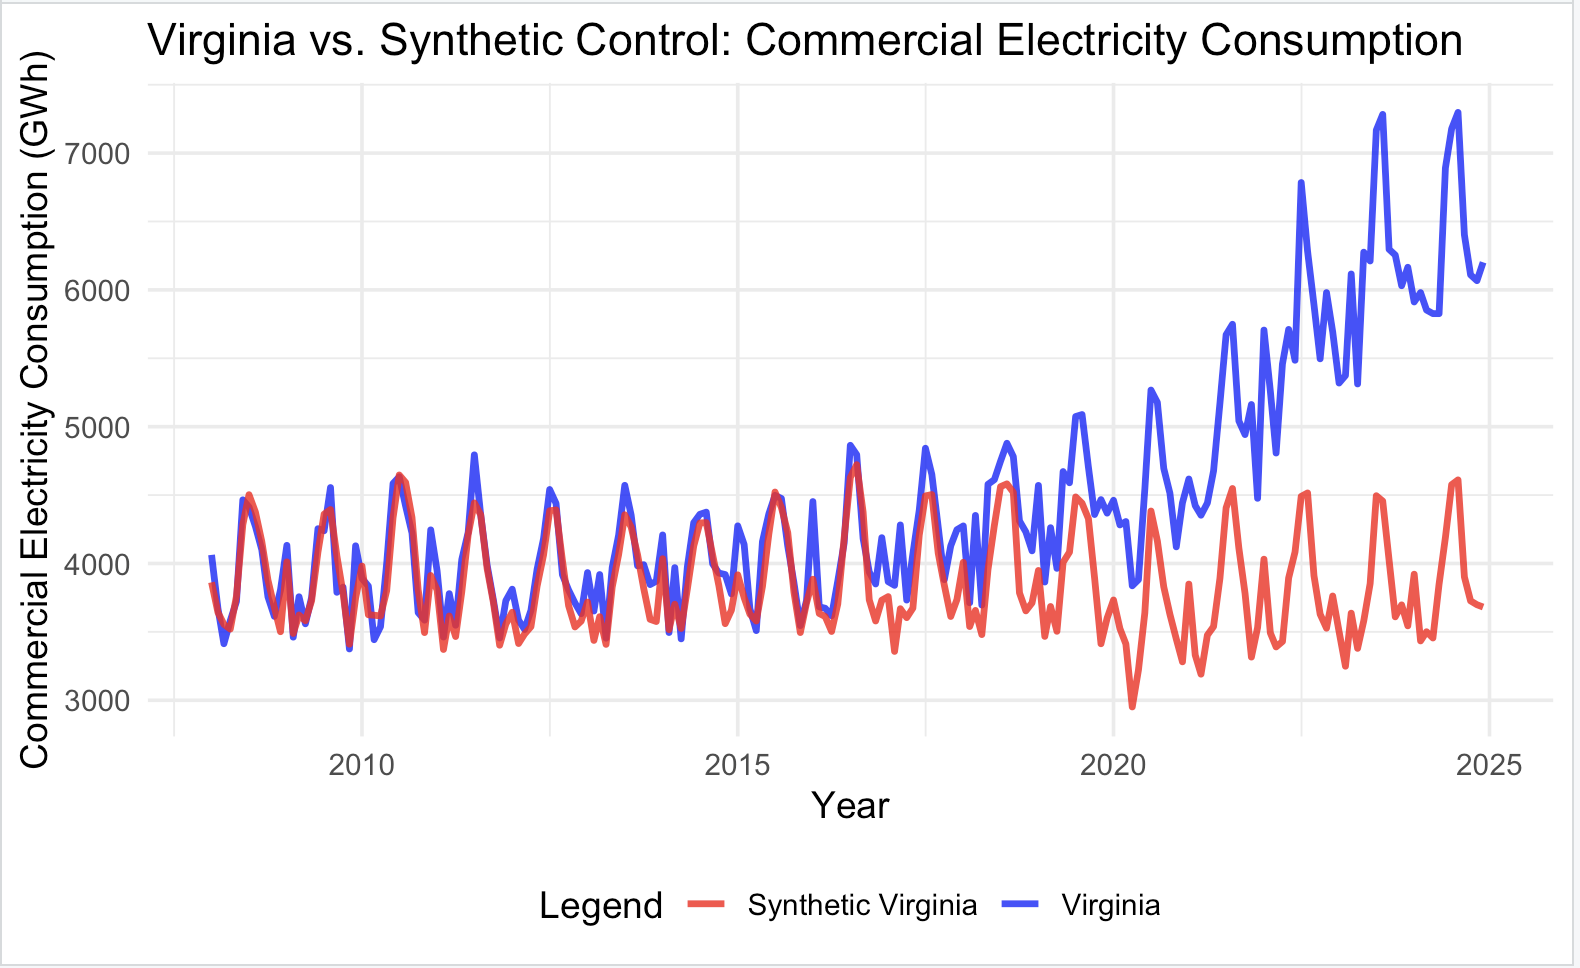
Figure 3 — Virginia (blue) vs. Synthetic Virginia (red). The synthetic counterfactual tracks Virginia closely until ~2015, after which actual consumption diverges dramatically upward.
Isolating the Data Centre Effect
The two charts below together tell the core story. On the left, the difference between Virginia's consumption and a weighted average of peer states grows steadily. On the right, the Synthetic Control gap — the estimated data-centre effect — climbs from near-zero to almost 3,000 GWh/month by 2024.
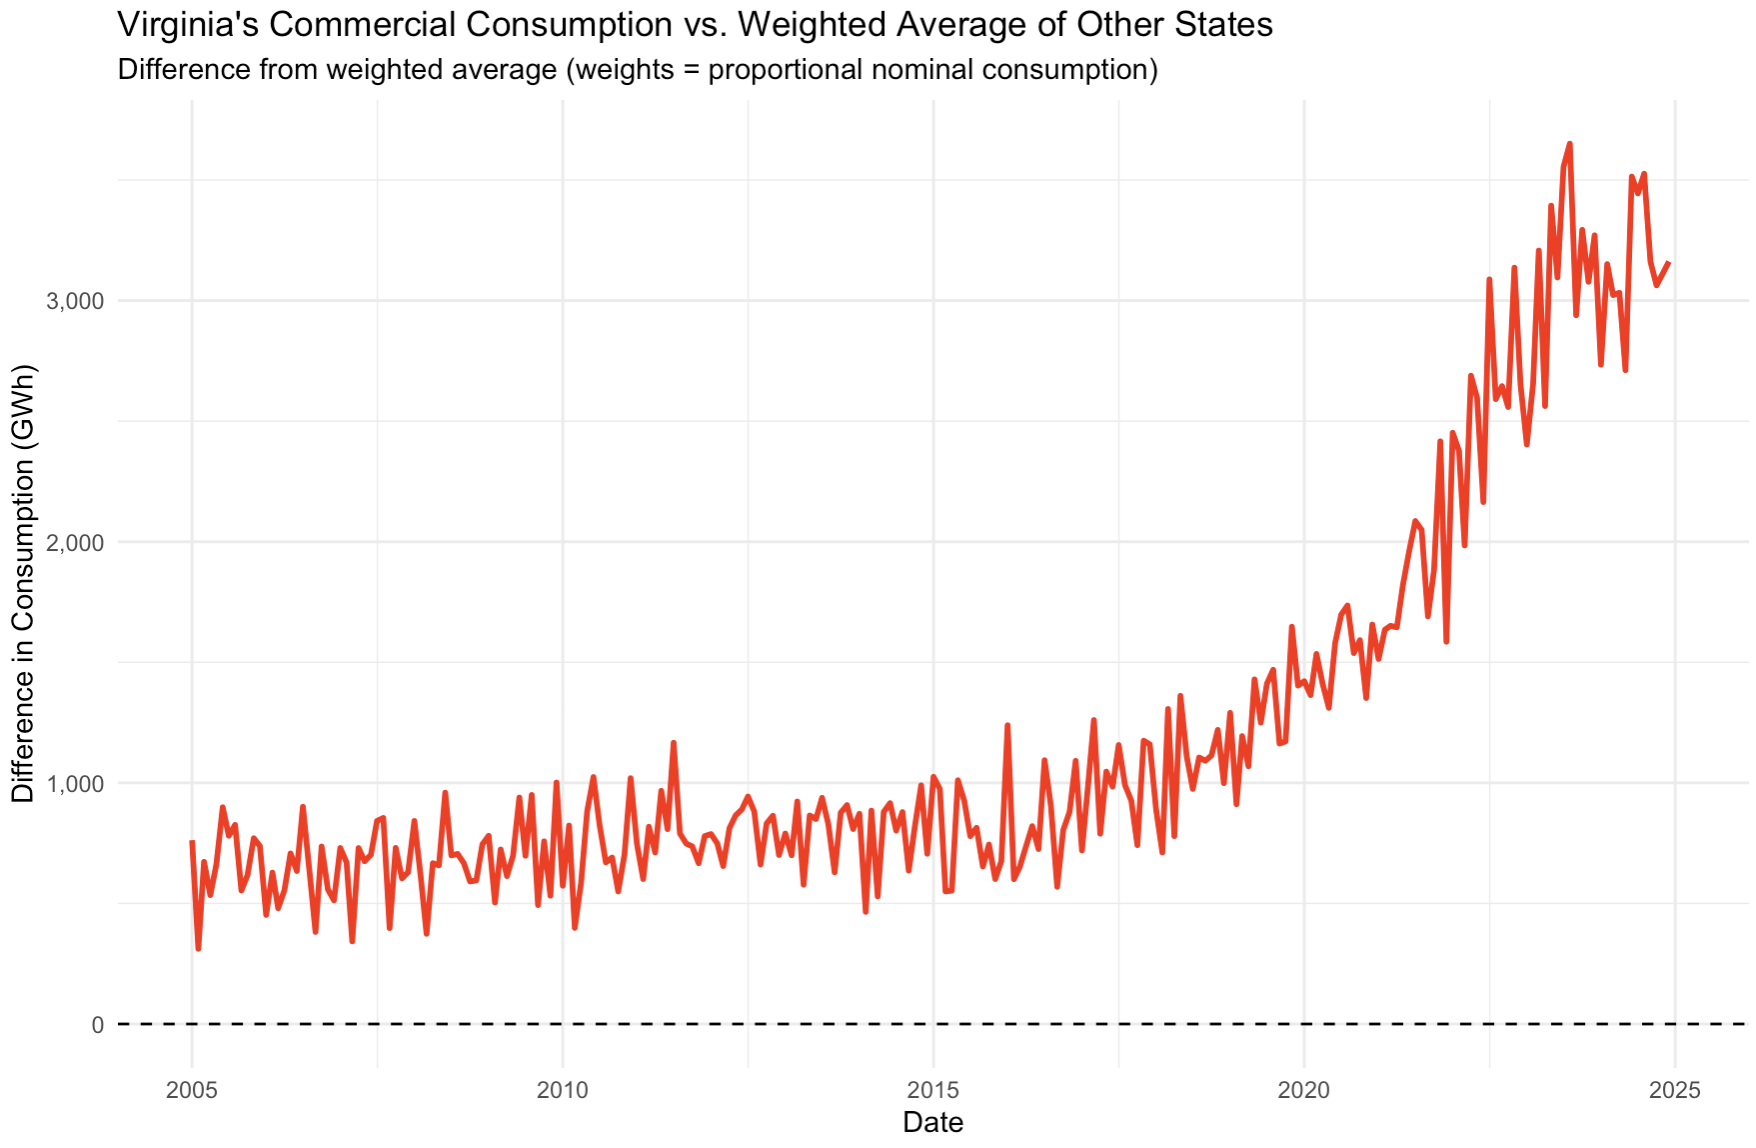
Figure 4a — Virginia vs. weighted average of peer states.
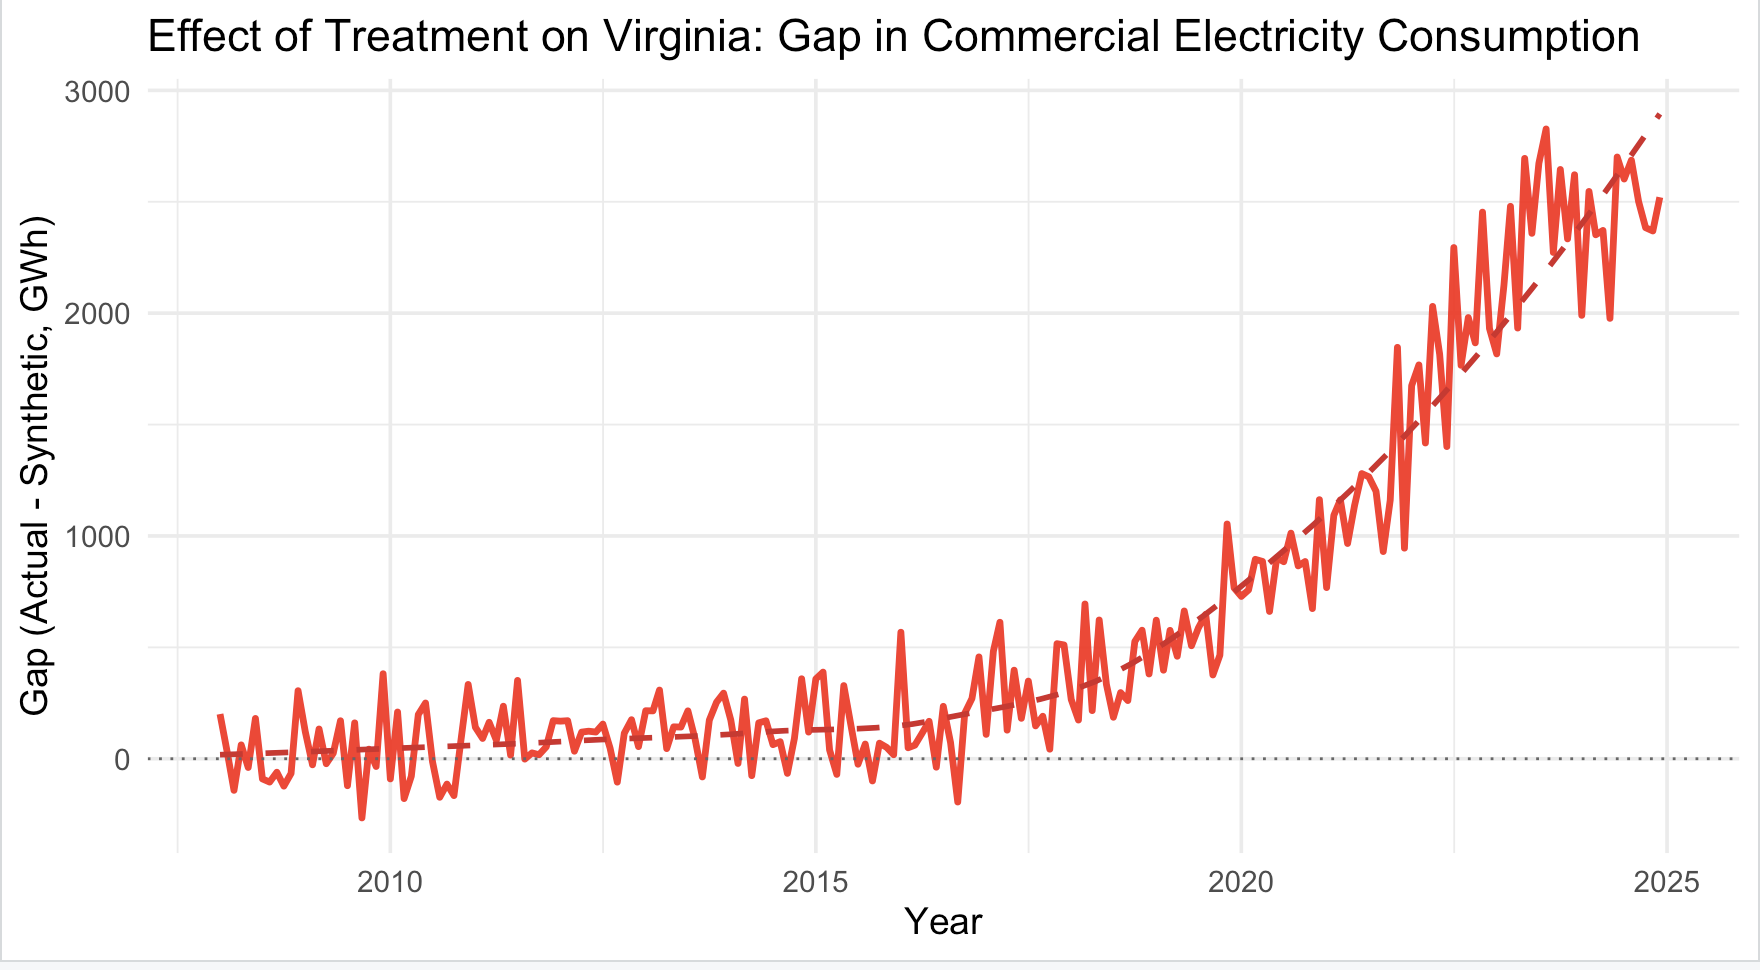
Figure 4b — The synthetic control gap (actual minus synthetic).
The synthetic gap when aggregated to annual data is equal to 28 TWh for 2023, only a 15% mismatch. This yields two important results. First, the experiment tends to predict market dynamics in line with official estimates and existing literature.
In other words, the synthetic control successfully captures the non-data-centre dynamics of Virginia's power market, and the residual gap aligns closely with independent engineering estimates of data centre power draw.
Price Spillover into Neighbouring Markets
Following the structural break and synthetic control analyses, I investigate the dynamic interdependencies between Virginia's commercial electricity consumption and the potential impact of data centres onto electricity prices.
A Vector Auto-Regression (VAR) model with impulse response functions reveals that a shock to Virginia's synthetic consumption residual — the data-centre proxy — has a statistically significant positive effect on commercial and industrial electricity prices in neighbouring Pennsylvania. The effect is persistent: prices remain elevated for over 20 months after a one-standard-deviation shock.
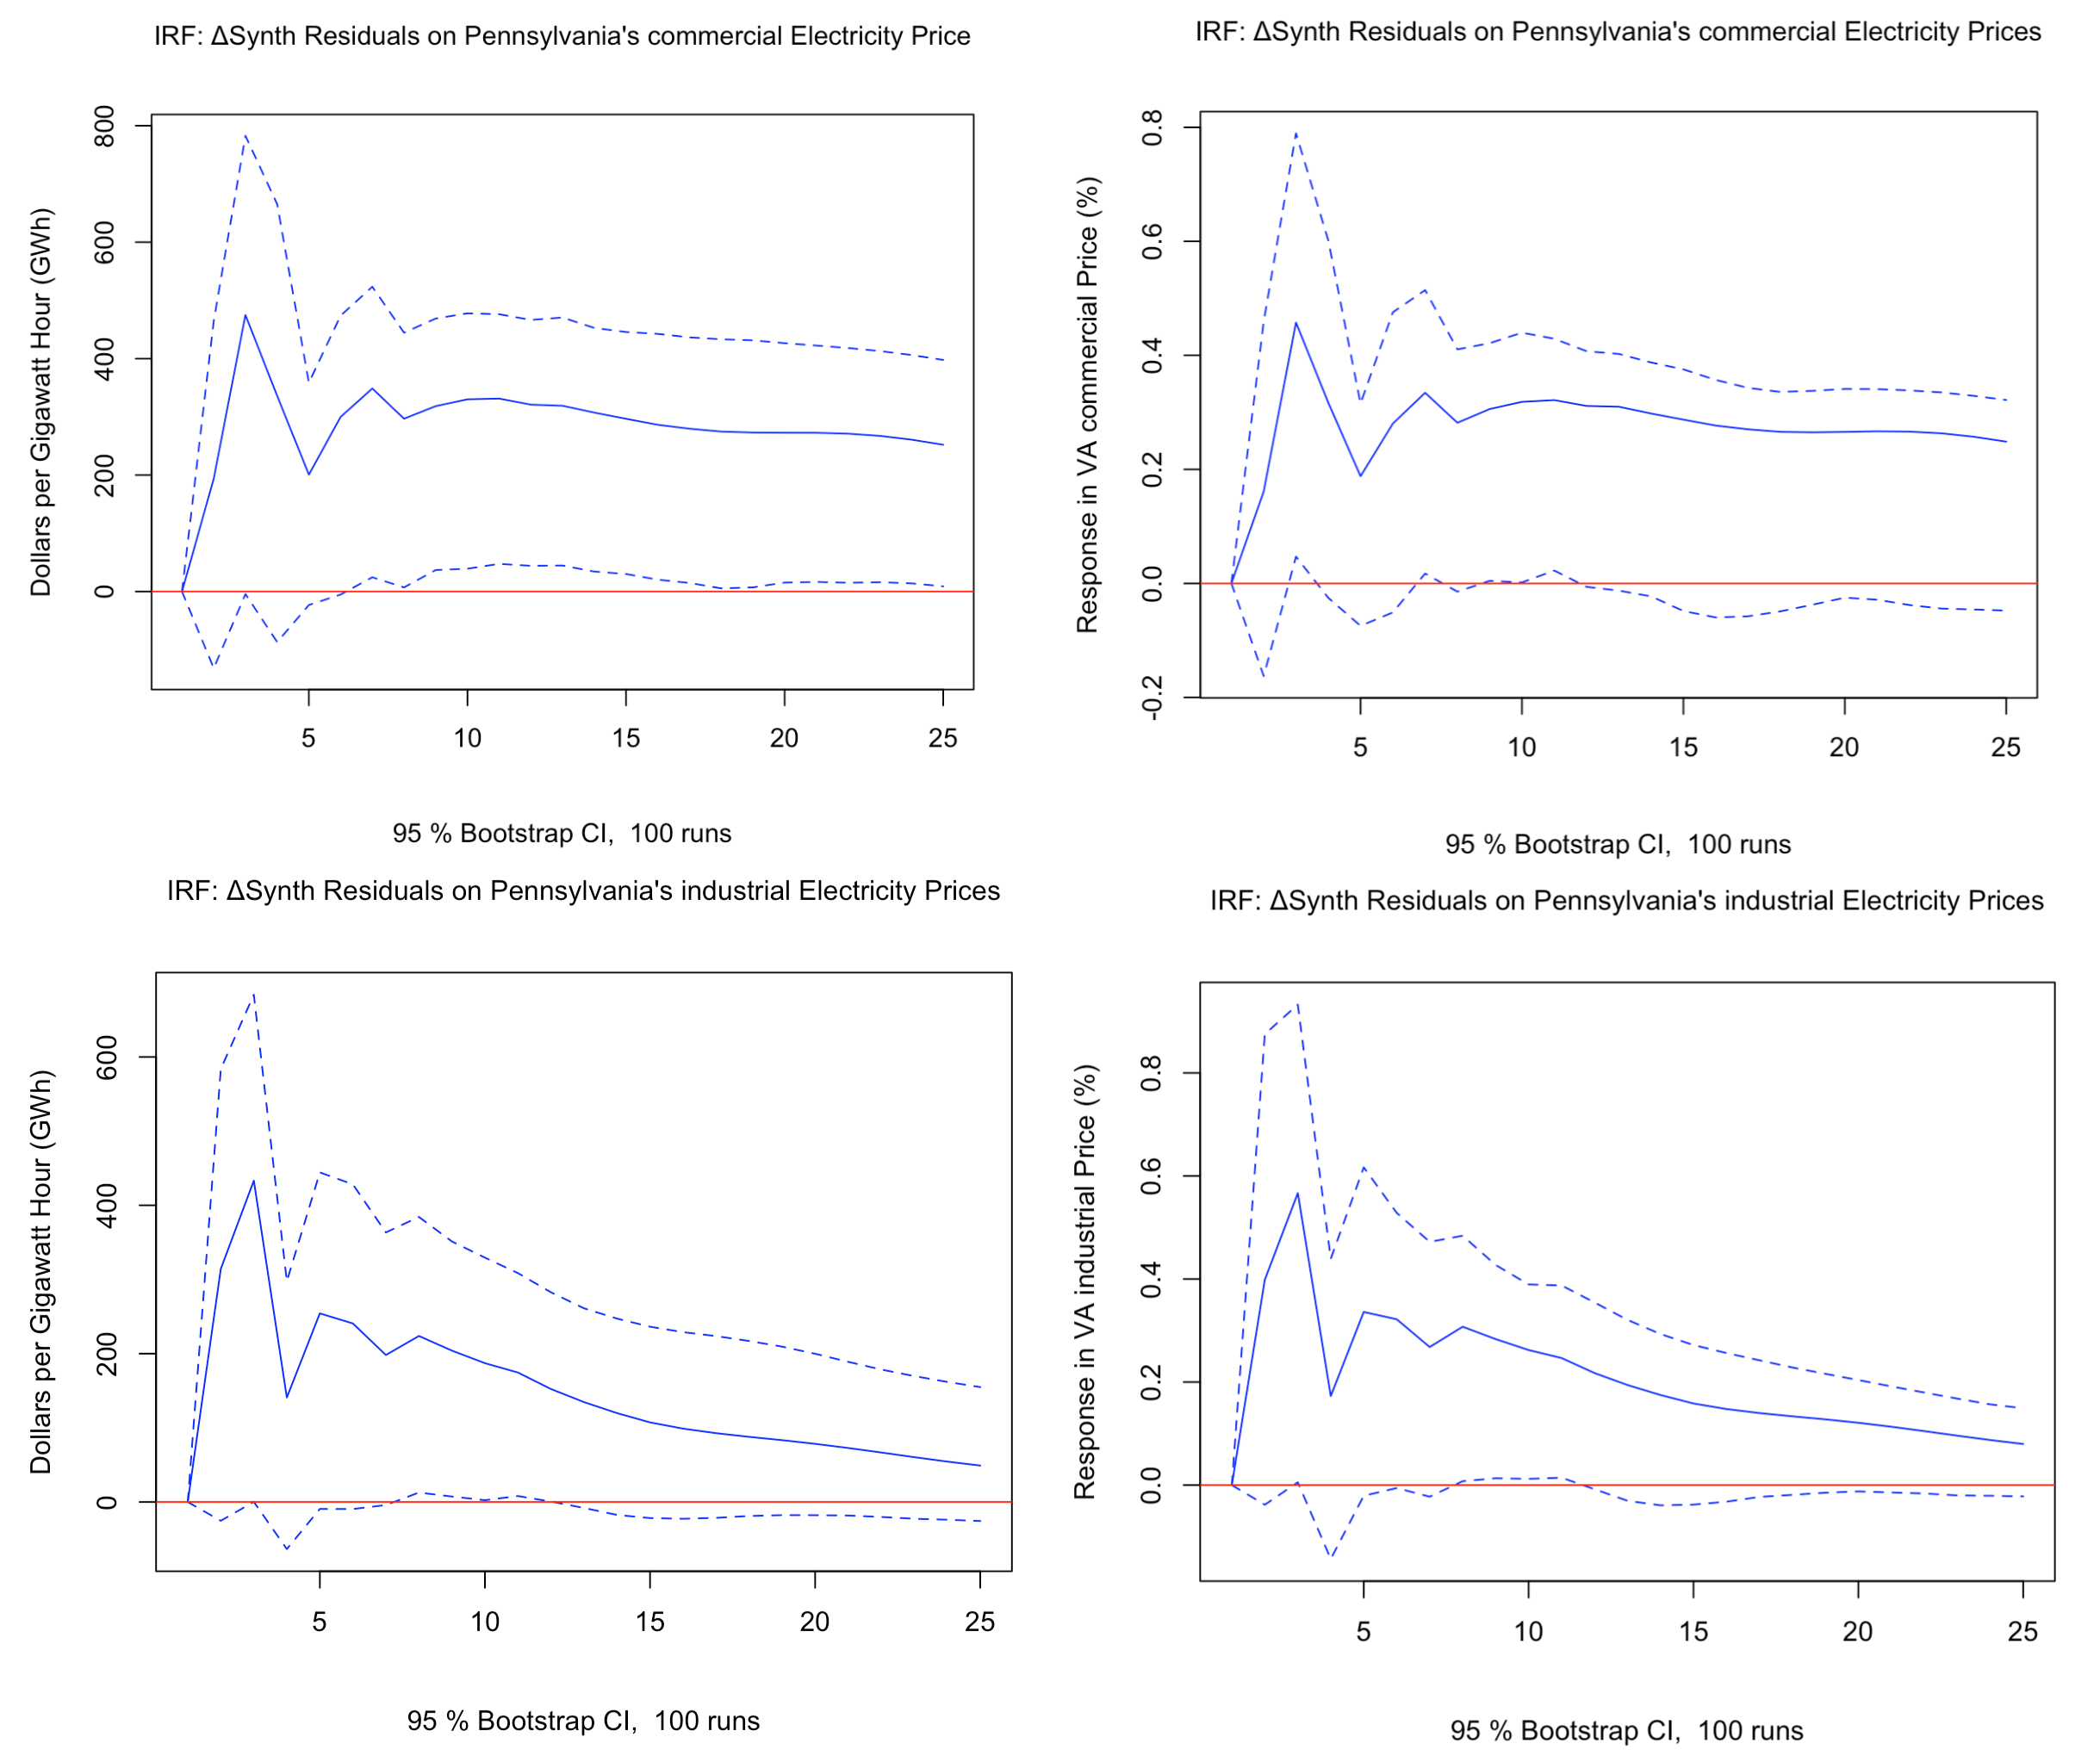
Figure 5 — Impulse response functions showing the price spillover from Virginia's data centre consumption onto Pennsylvania's commercial and industrial electricity prices (95% bootstrap CI).
Access the full thesis: